Demand Response Management System
Shifting power to the energy industry
Between 2016-2017, Orchestrated Energy (OE) was optimizing HVAC runtime on residential smart thermostats through a handful of utility pilot programs. One component of this program enabled utilities to call and dispatch Demand Response events to shift energy load on high demand days. The process for doing so was manual and cumbersome.
In the winter and spring of 2018, I was part of a team that designed and built a custom Demand Response Management System (DRMS) that empowered utility partners to run their programs easily and autonomously.
Accomplishments
Increased Autonomy
Users are able to create, edit, and cancel events in less than 1 minute.
Reduced invisible work
Fewer daily, weekly and monthly reports for our team to create and manage via email.
Simplified processes
Our users reported the DRMS as being
easy to use and helped them meet their program targets
Delighted & Legitimized
To our users, this is the face of OE and it gave them confidence in our ability to meet their needs.
Keep reading to see how we did it...
Challenges & Objectives
Early OE adopters were running small pilot programs. To dispatch an event and receive reporting required a utility demand manager to send an email to a member of the customer success team to request an event and another one to request event reporting. As the program continued to scale, so did the need for tools that afforded demand managers the autonomy to efficiently run their programs.
Likewise, our own teams were manually processing and sending reports on a daily, weekly and monthly cadence. The time spent compiling and managing these reports was significant, and we needed to reduce their burden.
We also had one major technical constraint due to an early architecture decision. The DRMS and whatever reporting it needed to produce would have to use Looker’s out-of-the-box solution, a data analytics platform with limited customization capabilities.
Goals
1. Build a tool that allows demand managers to schedule and run Demand Response events
2. Allow demand managers and program managers to self-serve on program performance reporting
3. Reduce the number of reports our internal teams were manually creating and delivering
My Role
As part of a cross-functional team, I developed the UX strategy and led user research, ideation workshops, information architecture, wireframing, prototyping and testing of the DRMS.
I collaborated closely with product management to conduct interviews, develop requirements and test our solutions. Engineering and data scientists were brought into workshops to help ideate and sketch solutions.
My role with the product came to an end as the UI Designer worked to flesh out the detailed solution, though I made sure to partner with him to explain the ‘why’ and ‘how’ of each feature.
Kick-off
At the start of the project, I collaborated closely with a product manager to develop a strategy for conducting user research. Due to an external conflict, we were unable to conduct interviews with demand managers and program managers at the onset of the project. Instead we devised a plan that led with our assumptions that we would later validate with our users once their conflict was resolved.
To do so, I led a user story mapping workshop with engineers, product management and data scientists. Using our knowledge of the space and competitors, we mapped out what we believed to be the skeleton of what this tool would need to provide. We then fleshed out in detail what we assumed users would want to do with the tool to help inform future features. We knew that leading with story mapping before research would mean we would inevitably have to correct the map, but it was far more valuable to get a head start on that work rather than waste weeks of work.
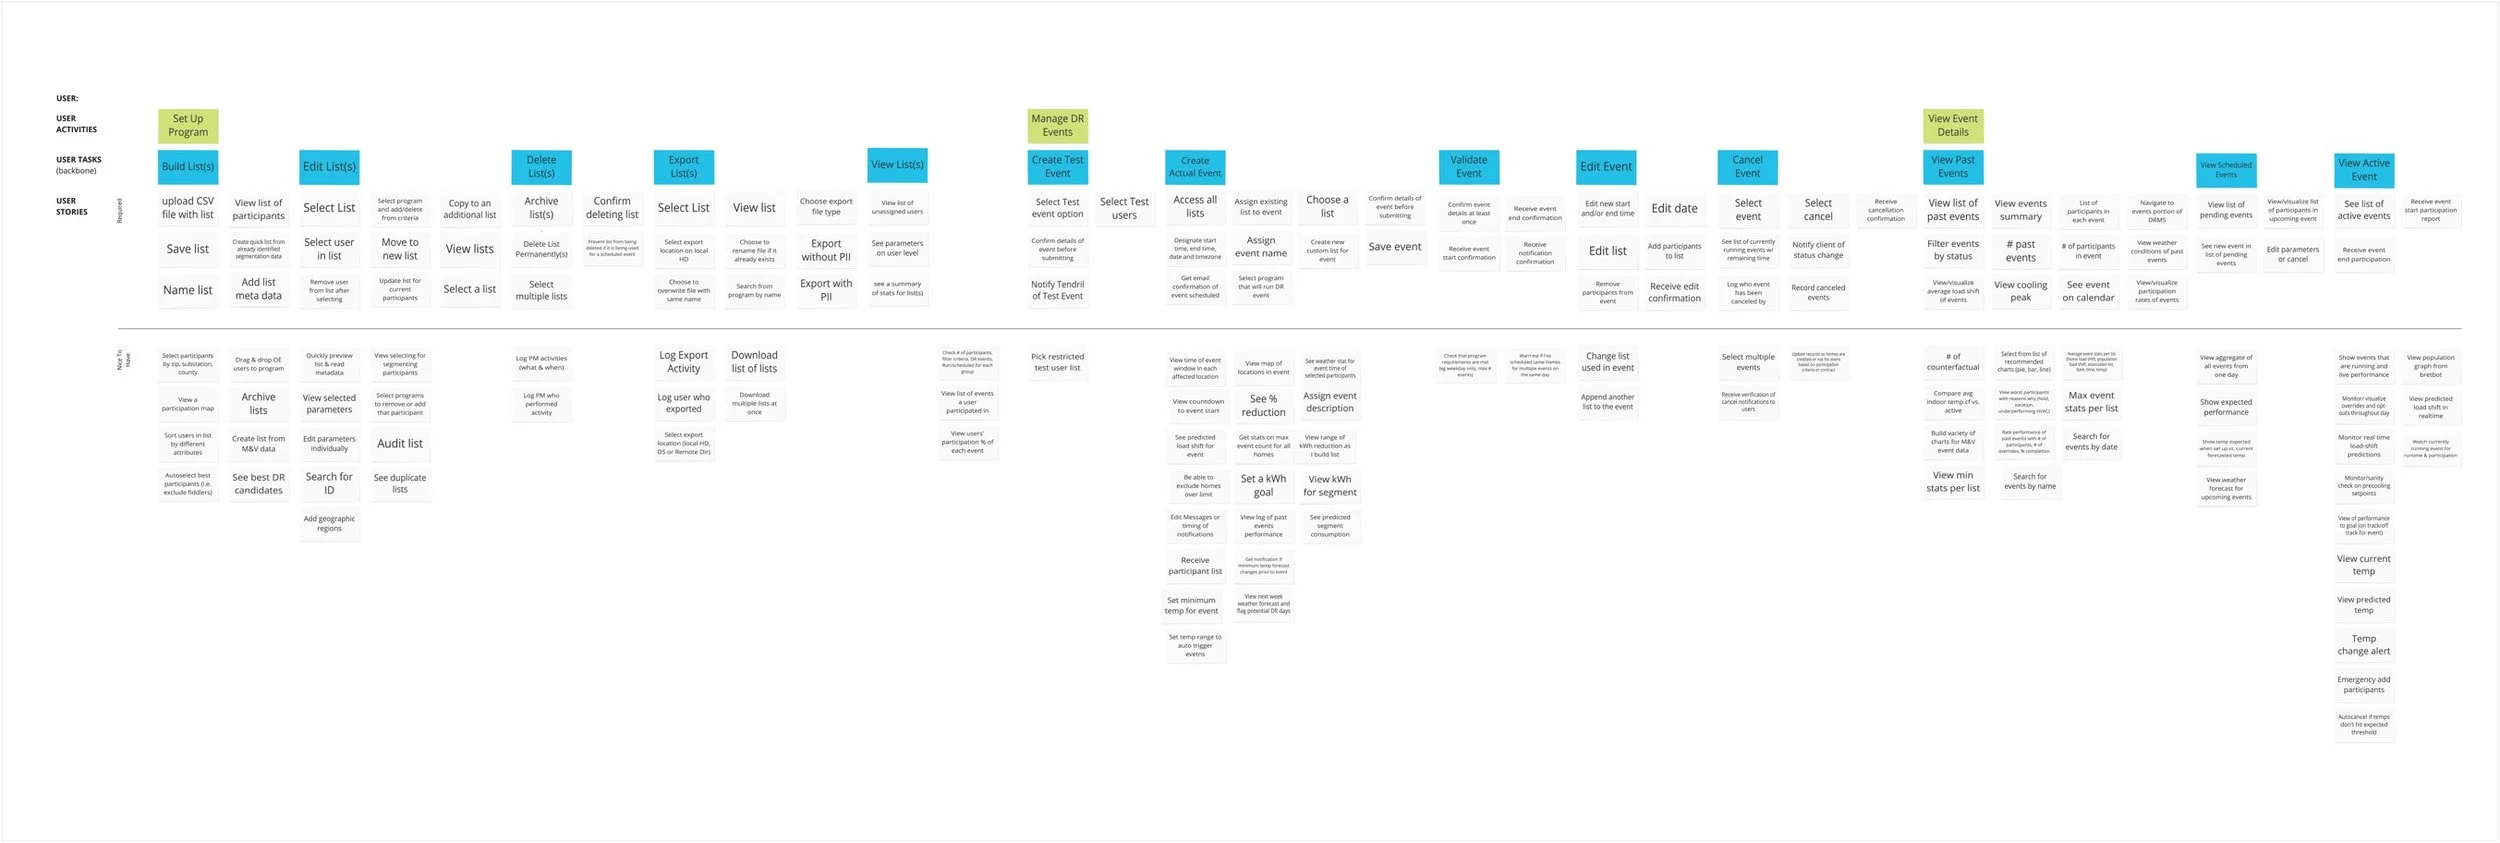
Initial user story map based on our assumptions
Research Insights
Once we had the opportunity to conduct interviews with our users, we had a better grasp of what they really needed the tool to do.
Guaranteed peak load shift
When peak demand occurs, they need to be able to shift the energy to avoid turning on more expensive power plants. Failing to do so could hurt their reputation with customers and jeopardize their entire program.
‘Dummy-proof’
There are a lot of moving parts and people involved in calculating a demand event. Often, the person scheduling the event does not have the insight into the ‘why’, they’re just responsible for executing. The system needed to be so simple that it was virtually impossible to make a mistake.
Highly reactive
Demand for energy can change quickly and there’s often a need for emergency events or a need to adjust the event in order to comply with regulatory filings. The system needed to be able to support acting quickly and making changes as needed.
Ideation & iteration
Now that we had a solid understanding of our users’ primary needs and goals, it was time to re-evaluate the map and information architecture to begin envisioning the solution.
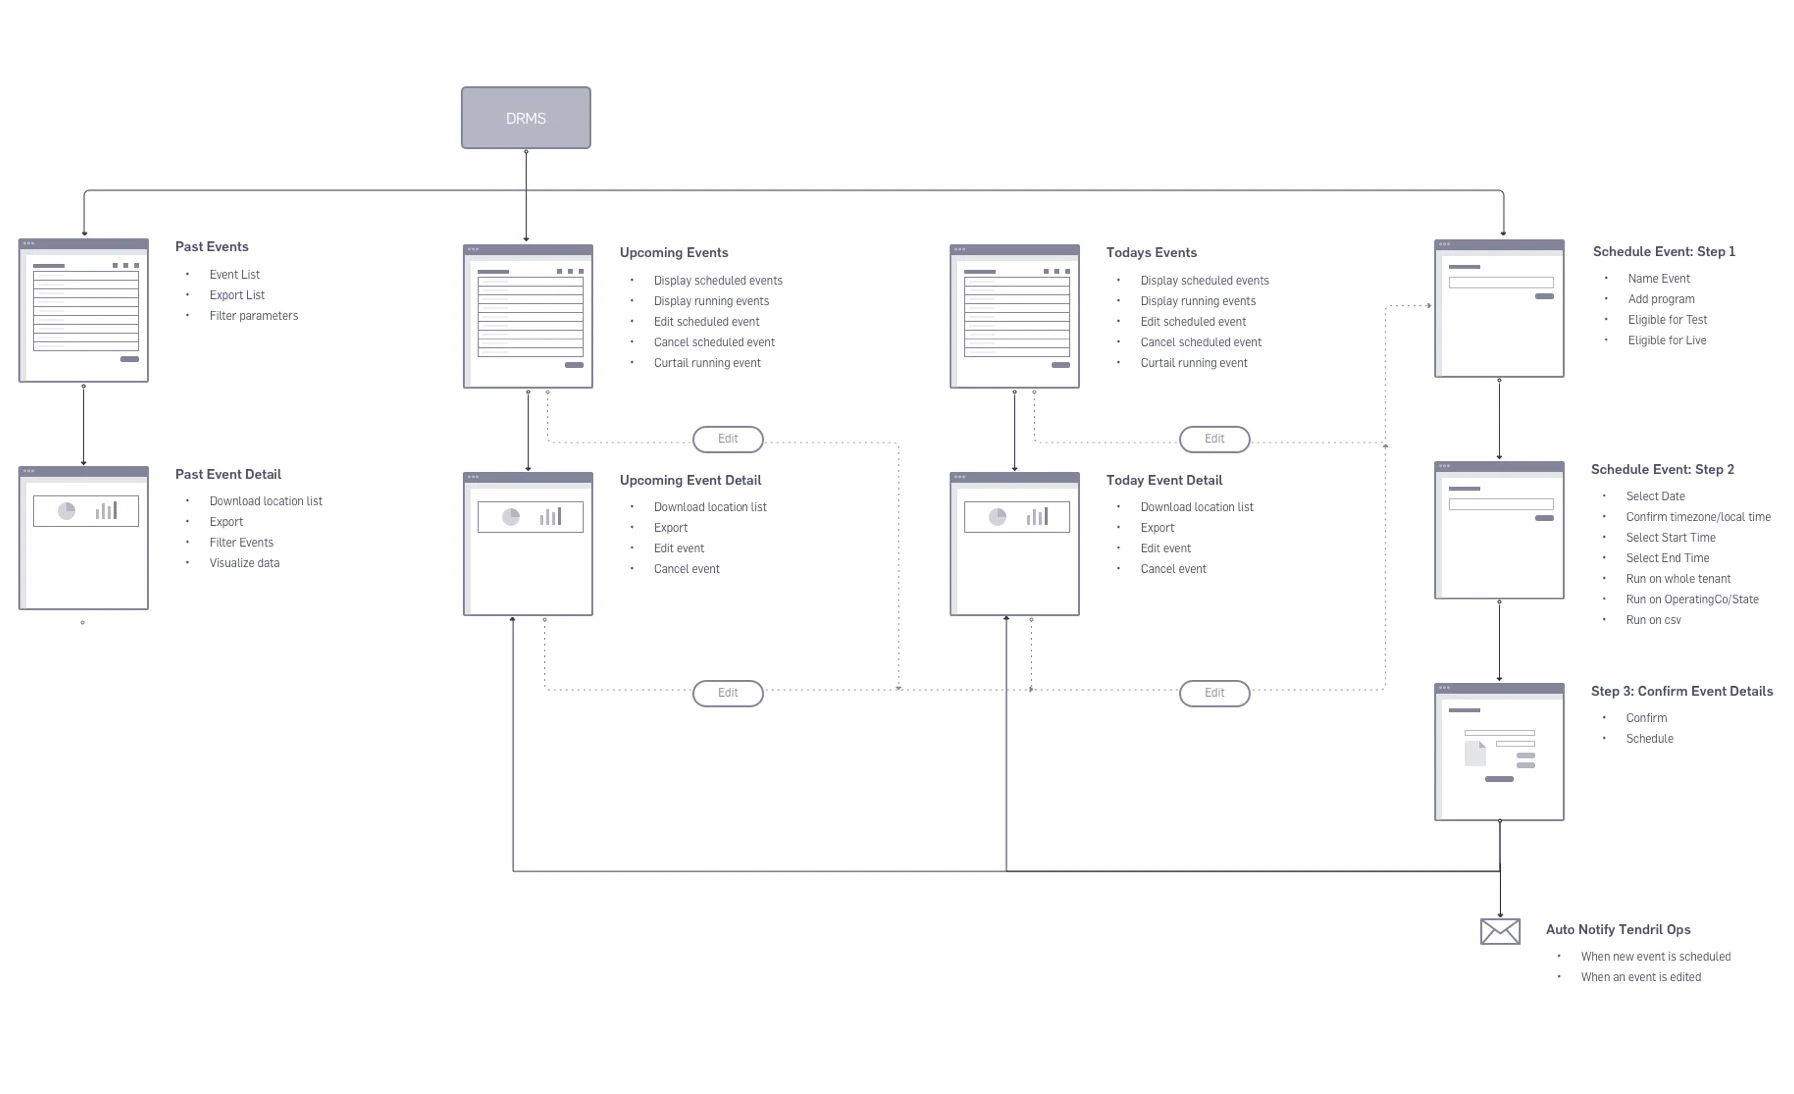
Revised user flow based on updated information architecture
I led the team through a series of design studio sessions to come up with ideas for both creating an event and a reporting dashboard. I also collaborated one-on-one with engineers and product to whiteboard out ideas and determine feasibility.

Sketches from our cross-functional design studio session

Sketches from our cross-functional design studio session
With several strong concepts, I was ready to wireframe. In order to create a Demand Response event, demand managers and members of their team needed to provide a lot of information. To simplify and streamline this, I landed on using a wizard to break up the steps, ensuring that users would not be able to miss a section or detail.
Through testing we were able to fine-tune the details of this flow. One of the key features we designed was the Load Shift Forecast tool, which would calculate in real-time the expected load shift of the event as inputs were entered. This aided users in determining whether the parameters would sufficiently meet their shift targets. In testing we saw task success for creating an event was 100% with high confidence and users reporting that it was easy and fast to complete.
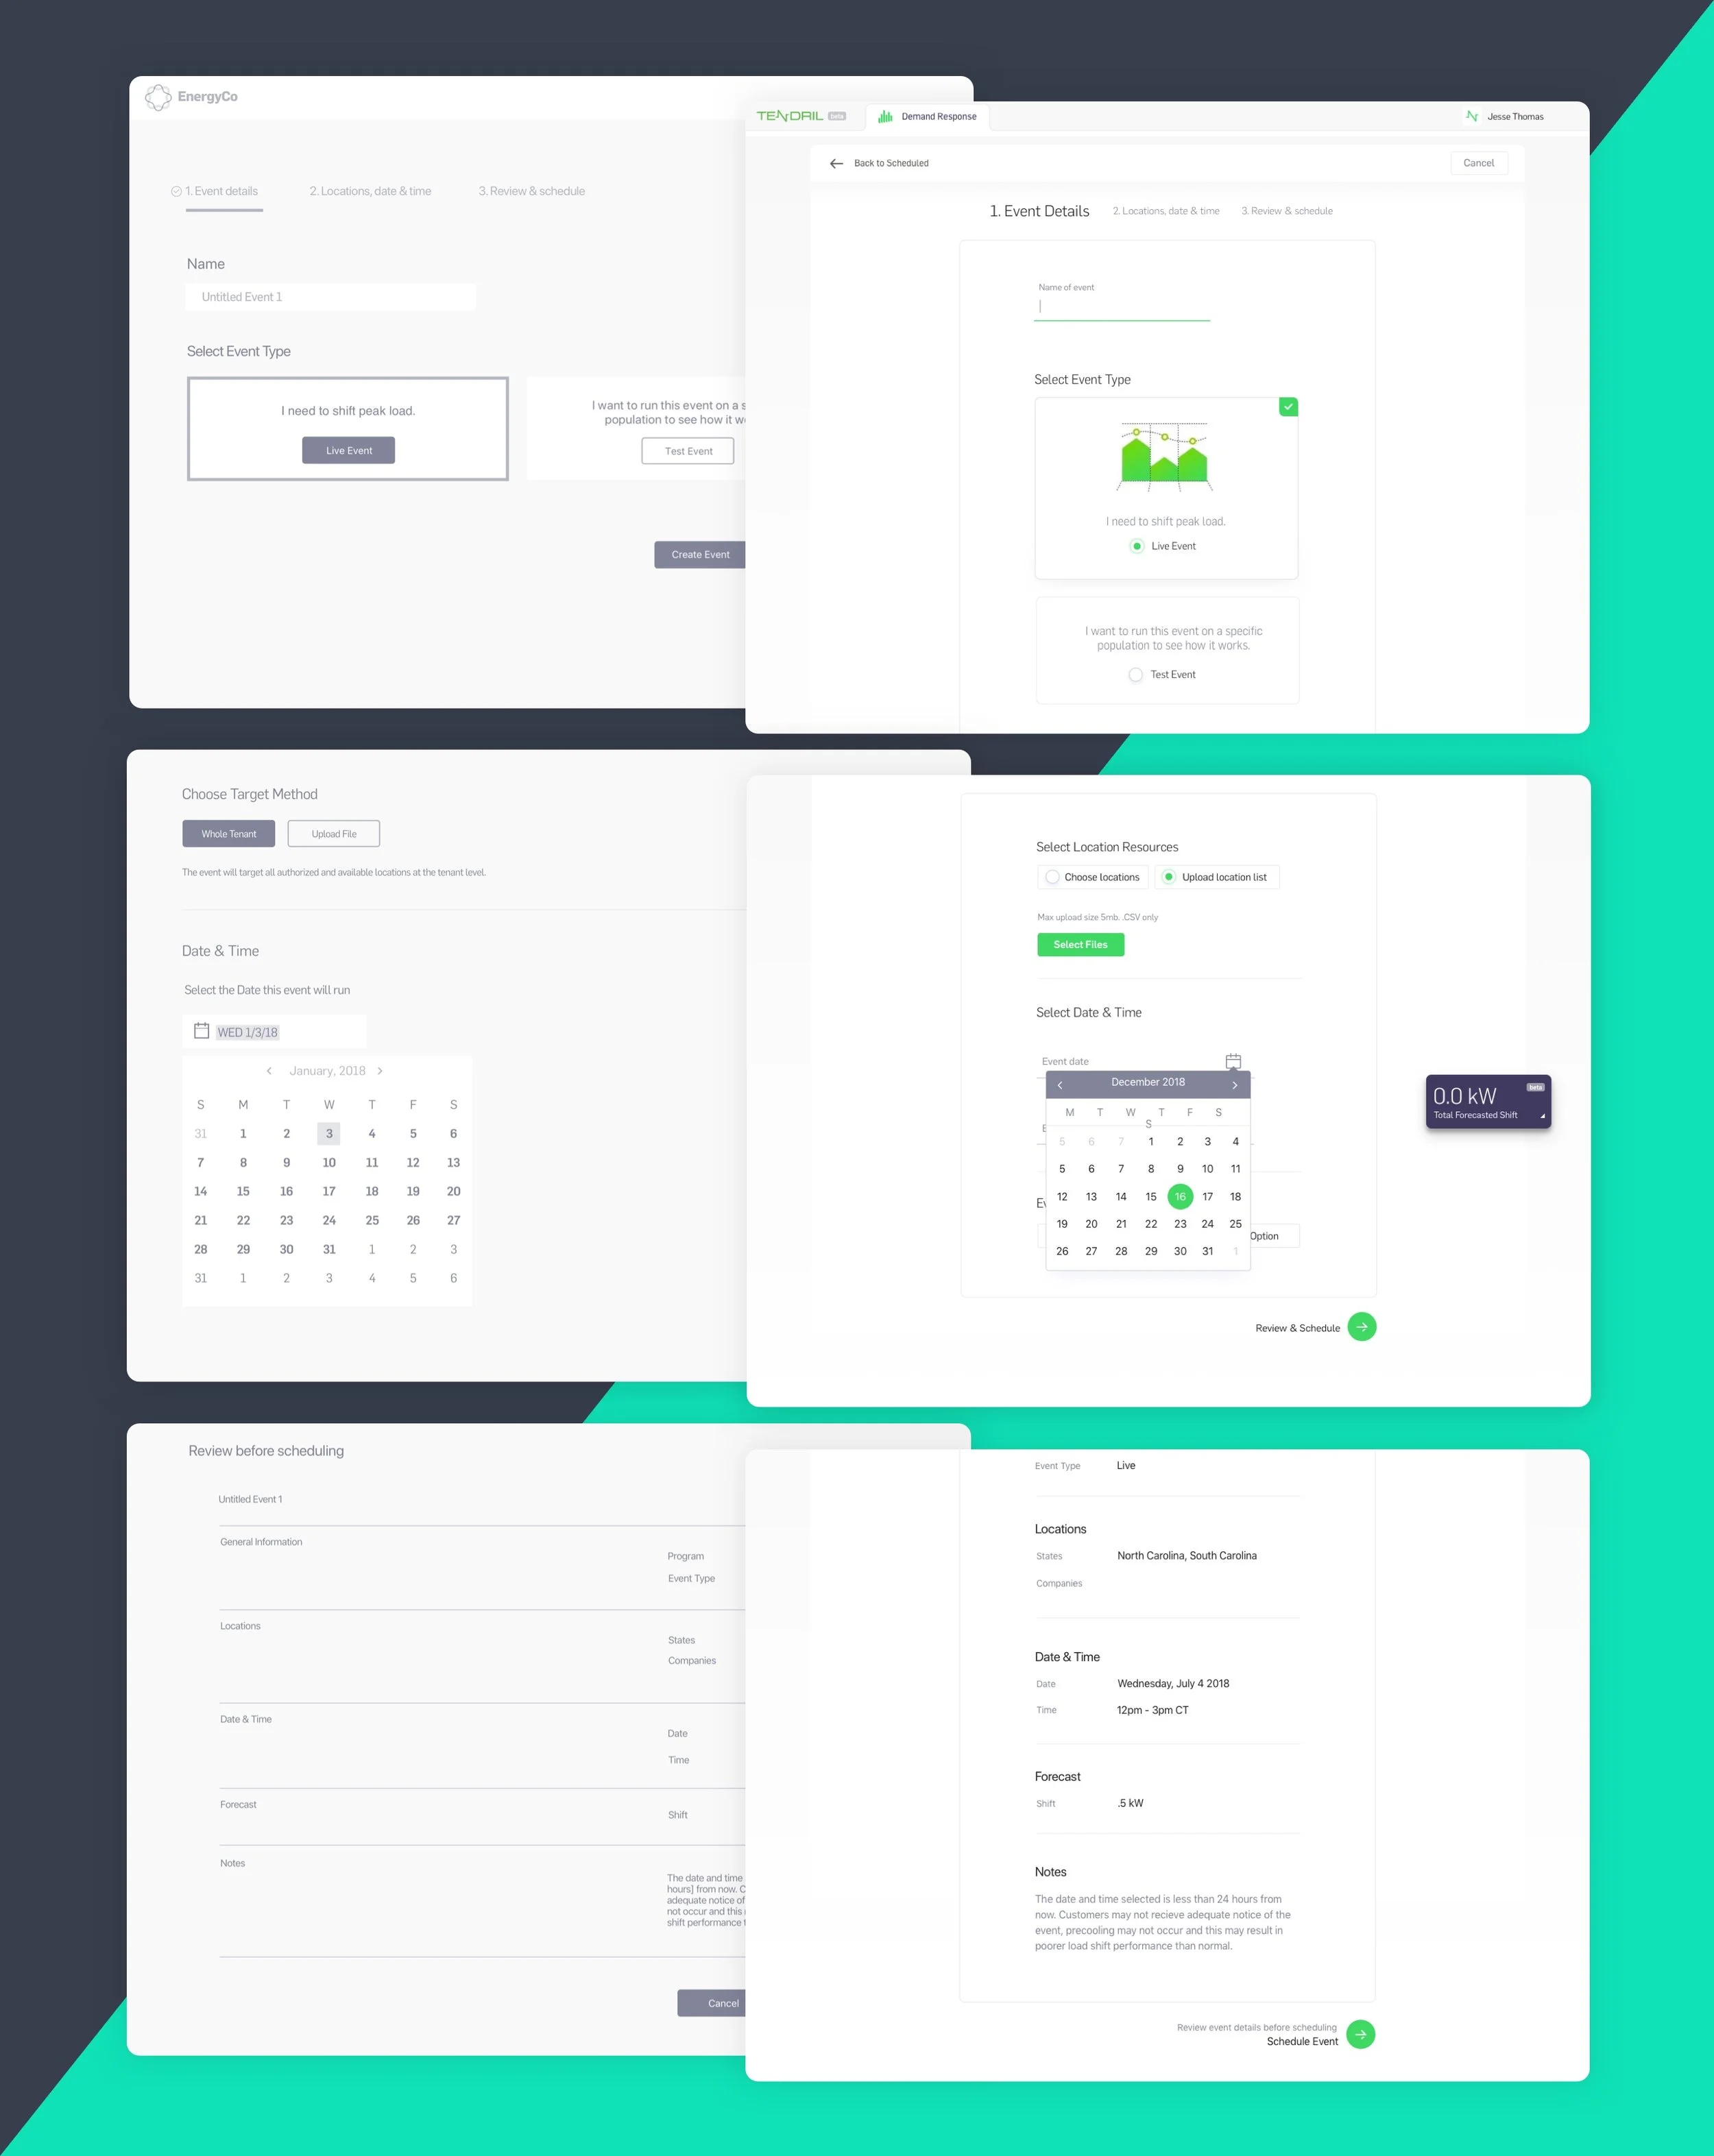
Early wireframes I created paired with the final UI from our UI Designer. Some data has been omitted for proprietary reasons.
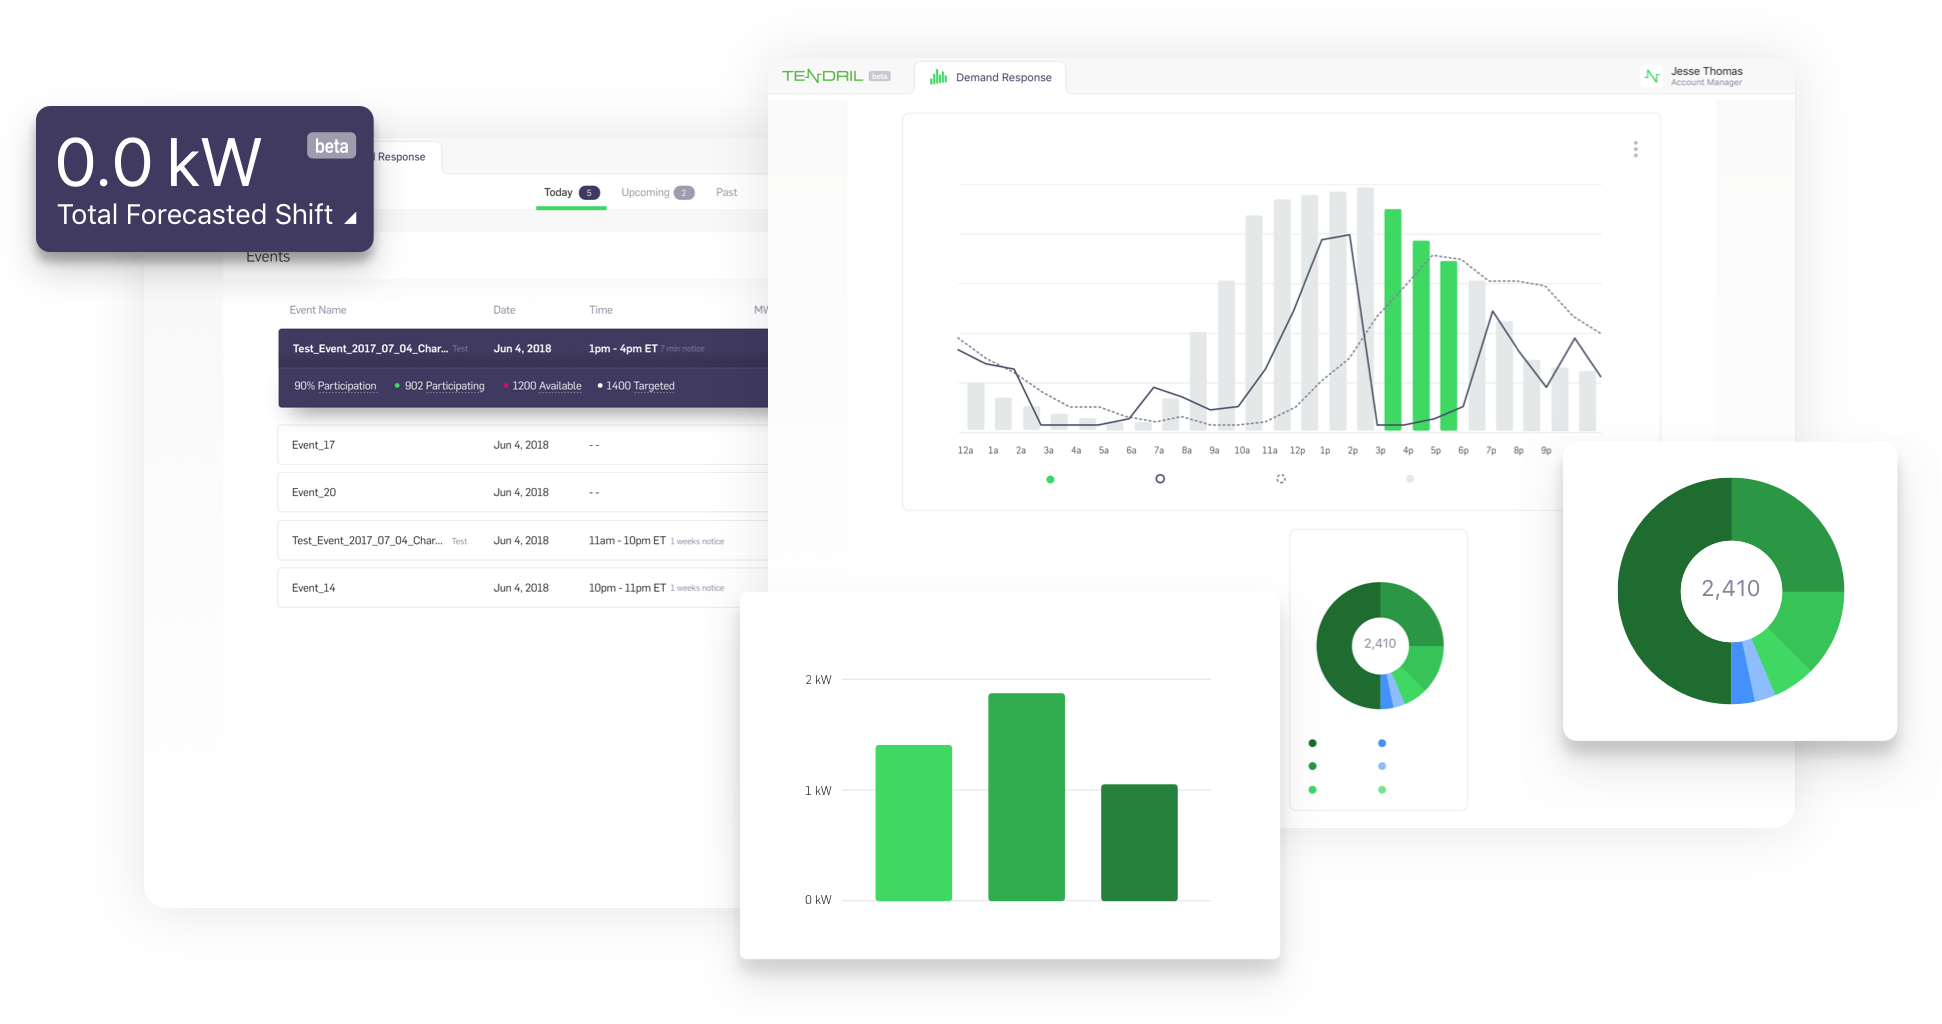
The main Event view went through several iterations as I worked to develop an information architecture that mirrored our users’ expectations. In this view, we wanted users to be able to easily navigate to all past, future and running events. It was important that running events displayed real-time data about homes that were actively participating in the event since most other event related data would not be available for up to 24 hours after the event ended. This real-time snapshot gave users a sense of whether the event would meet their shift targets and created peace of mind.
From this main view, users were also able to edit or cancel scheduled events as well as view full reports from past events.
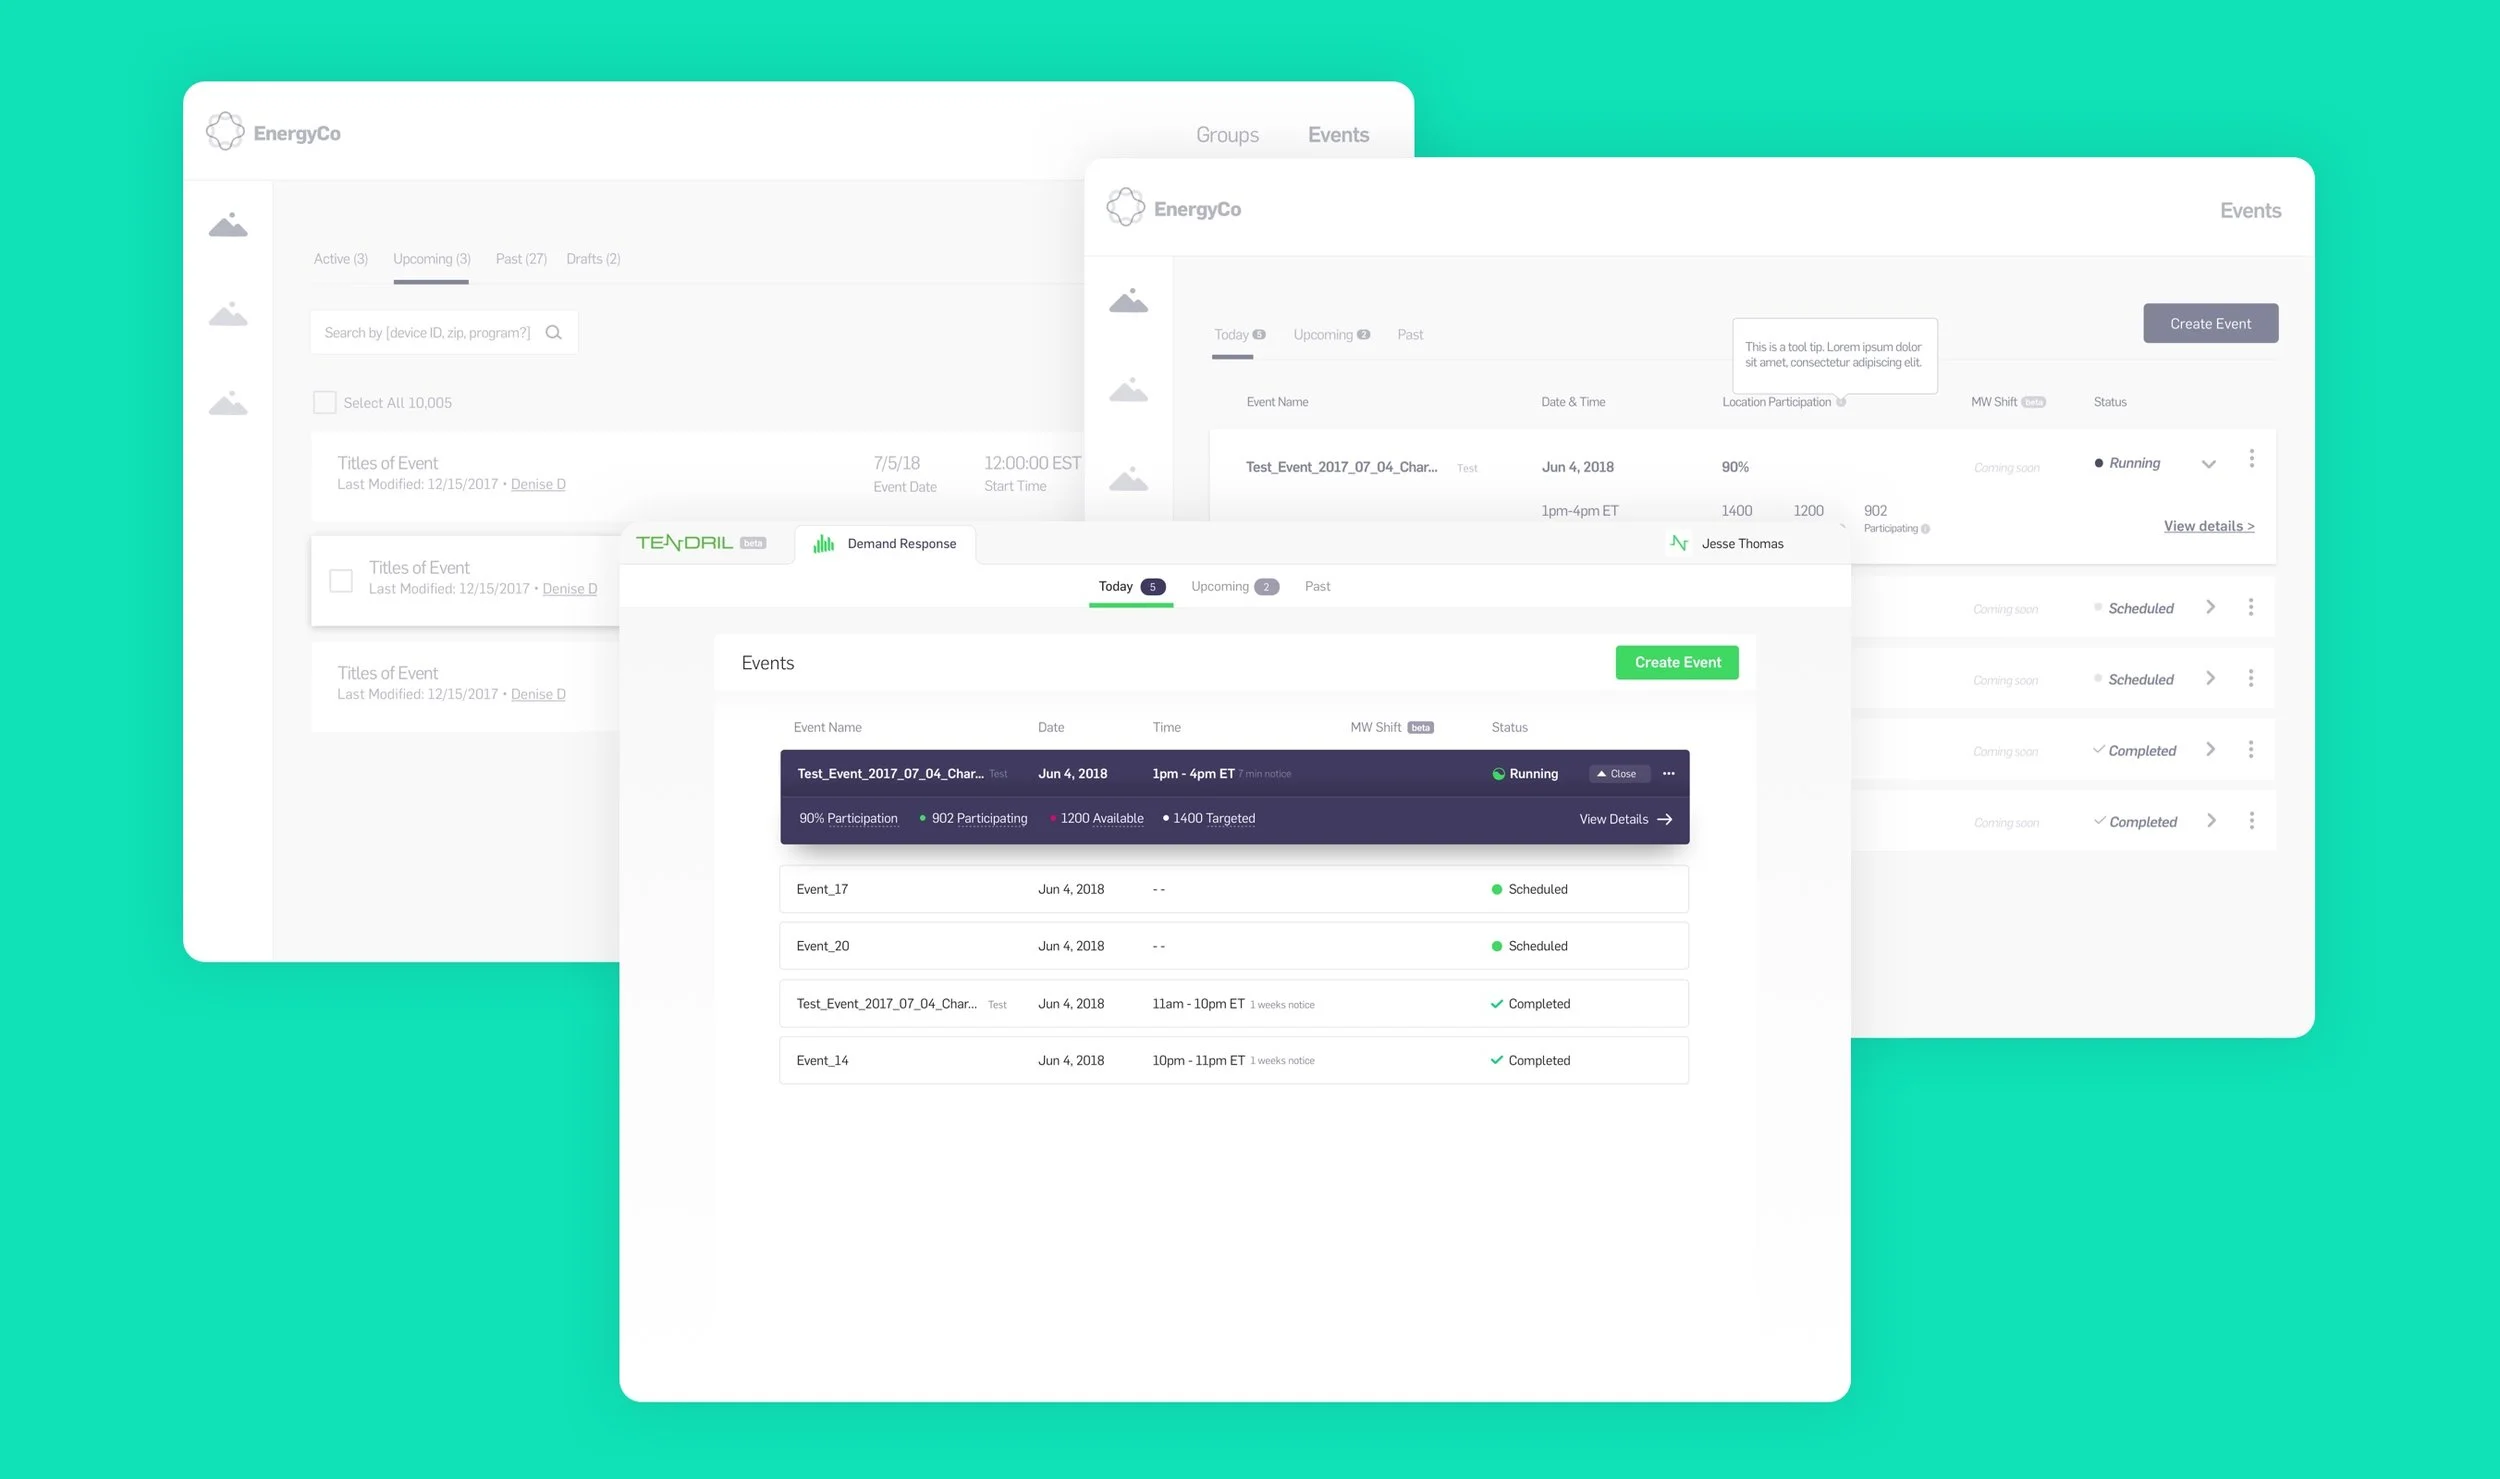
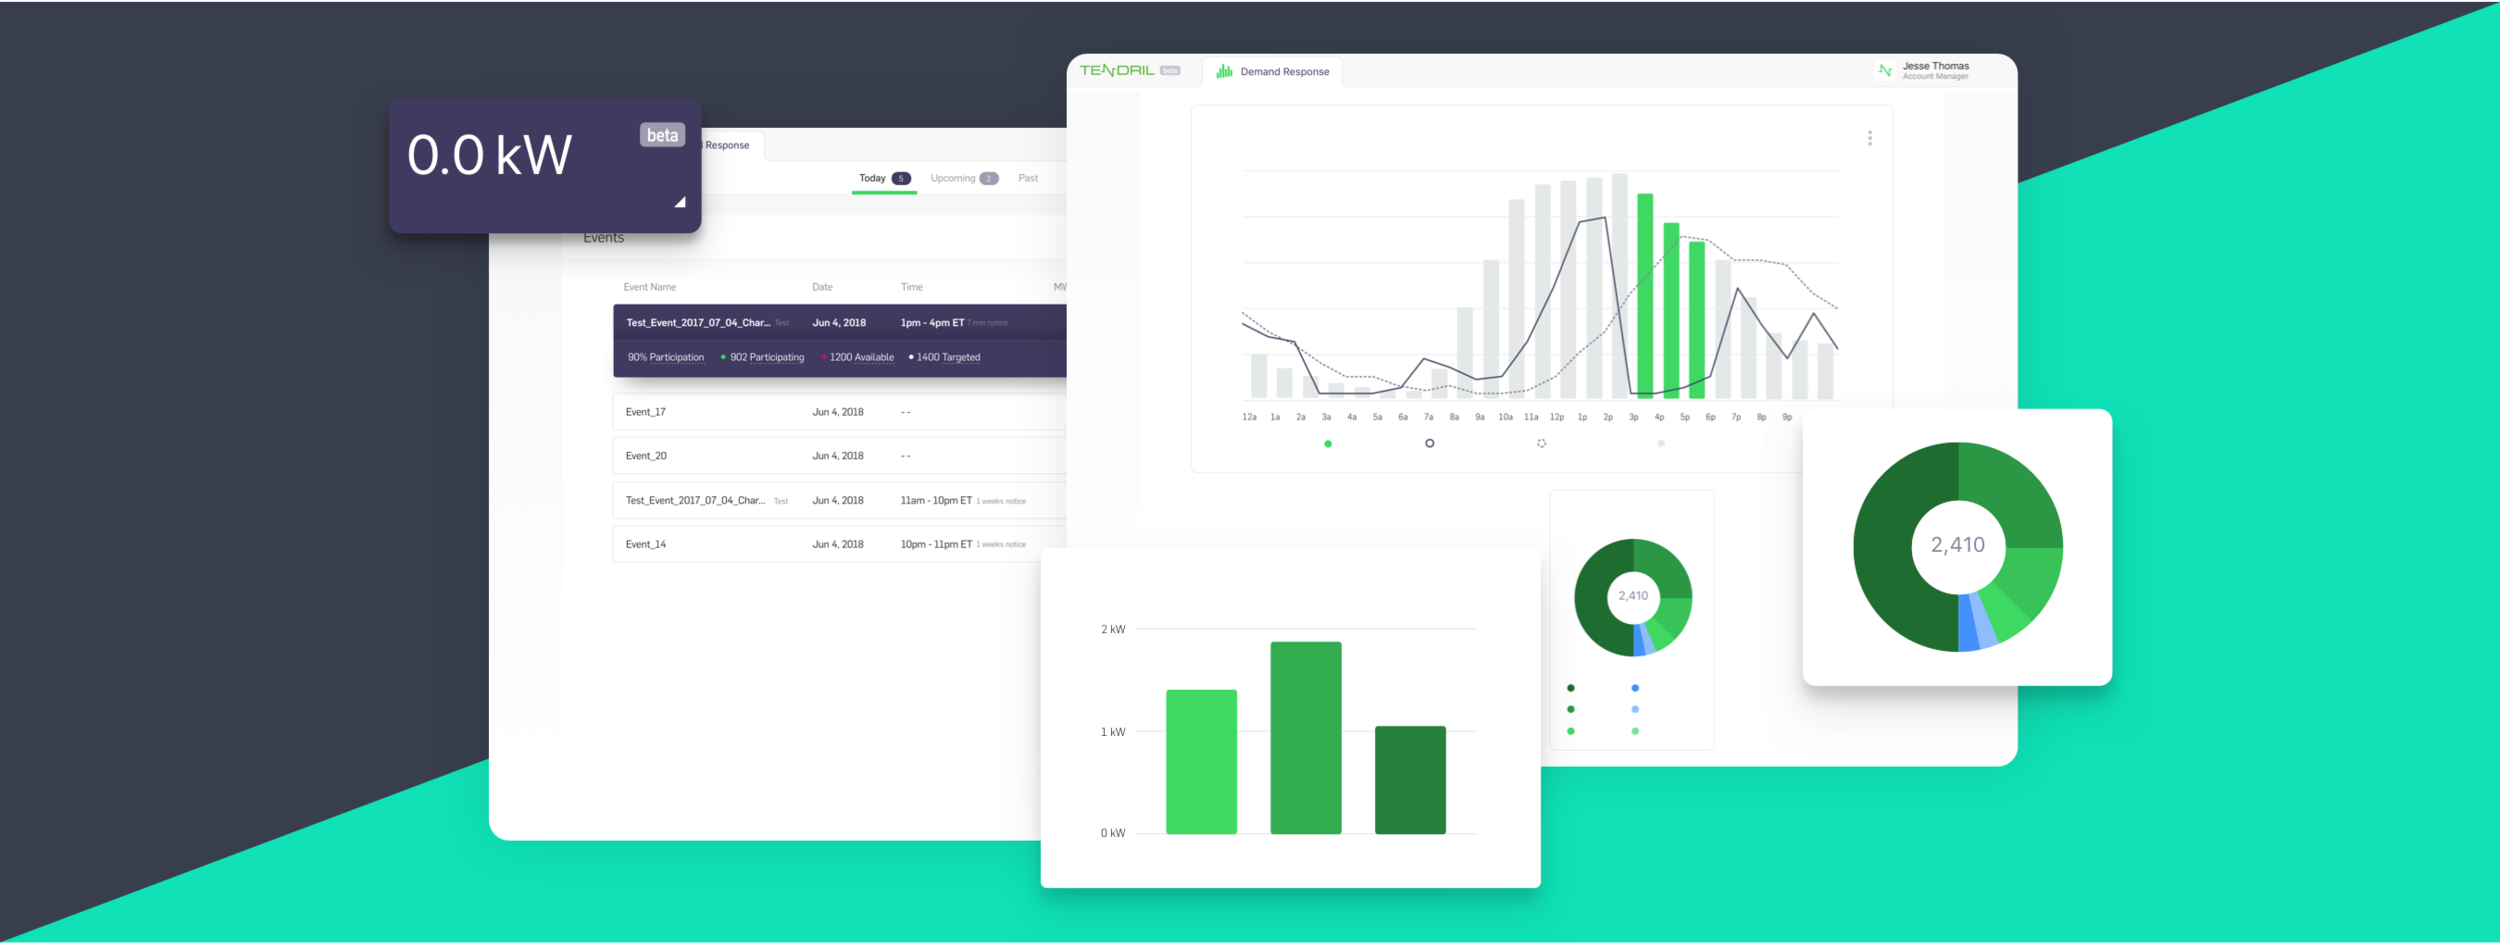
Early wireframes I created paired with the final UI from our UI Designer. Some data has been omitted for proprietary reasons.
Event reports were generated nearly 24 hours after the event had taken place. They needed to be all encompassing and rich with information so that program managers could distribute program performance information internally.
Demonstrating OE’s performance as an intelligent Demand Response solution was important for program managers running pilots. This is because utilities are often looking for the most cost effective solution for Peak Demand issues and, because they are looking to be able to offer their customers more engaging programs that will result in higher customer satisfaction.
A visual representation of the load shift also helps to demonstrate the impact OE is having. Using Looker as our charting tool meant that we were limited in some customization, the resulting Event Performance graph was therefore visually more noisy than ideal and offered less interaction, but generally delivered against the goal.
Lastly, it was important for program managers and demand managers to see how things like weather and opt-outs impacted performance. Similarly, they needed to understand why participation may not have been as high as they would have liked, so a detailed view of the status of homes and their total participation in the event was necessary to help them understand this.
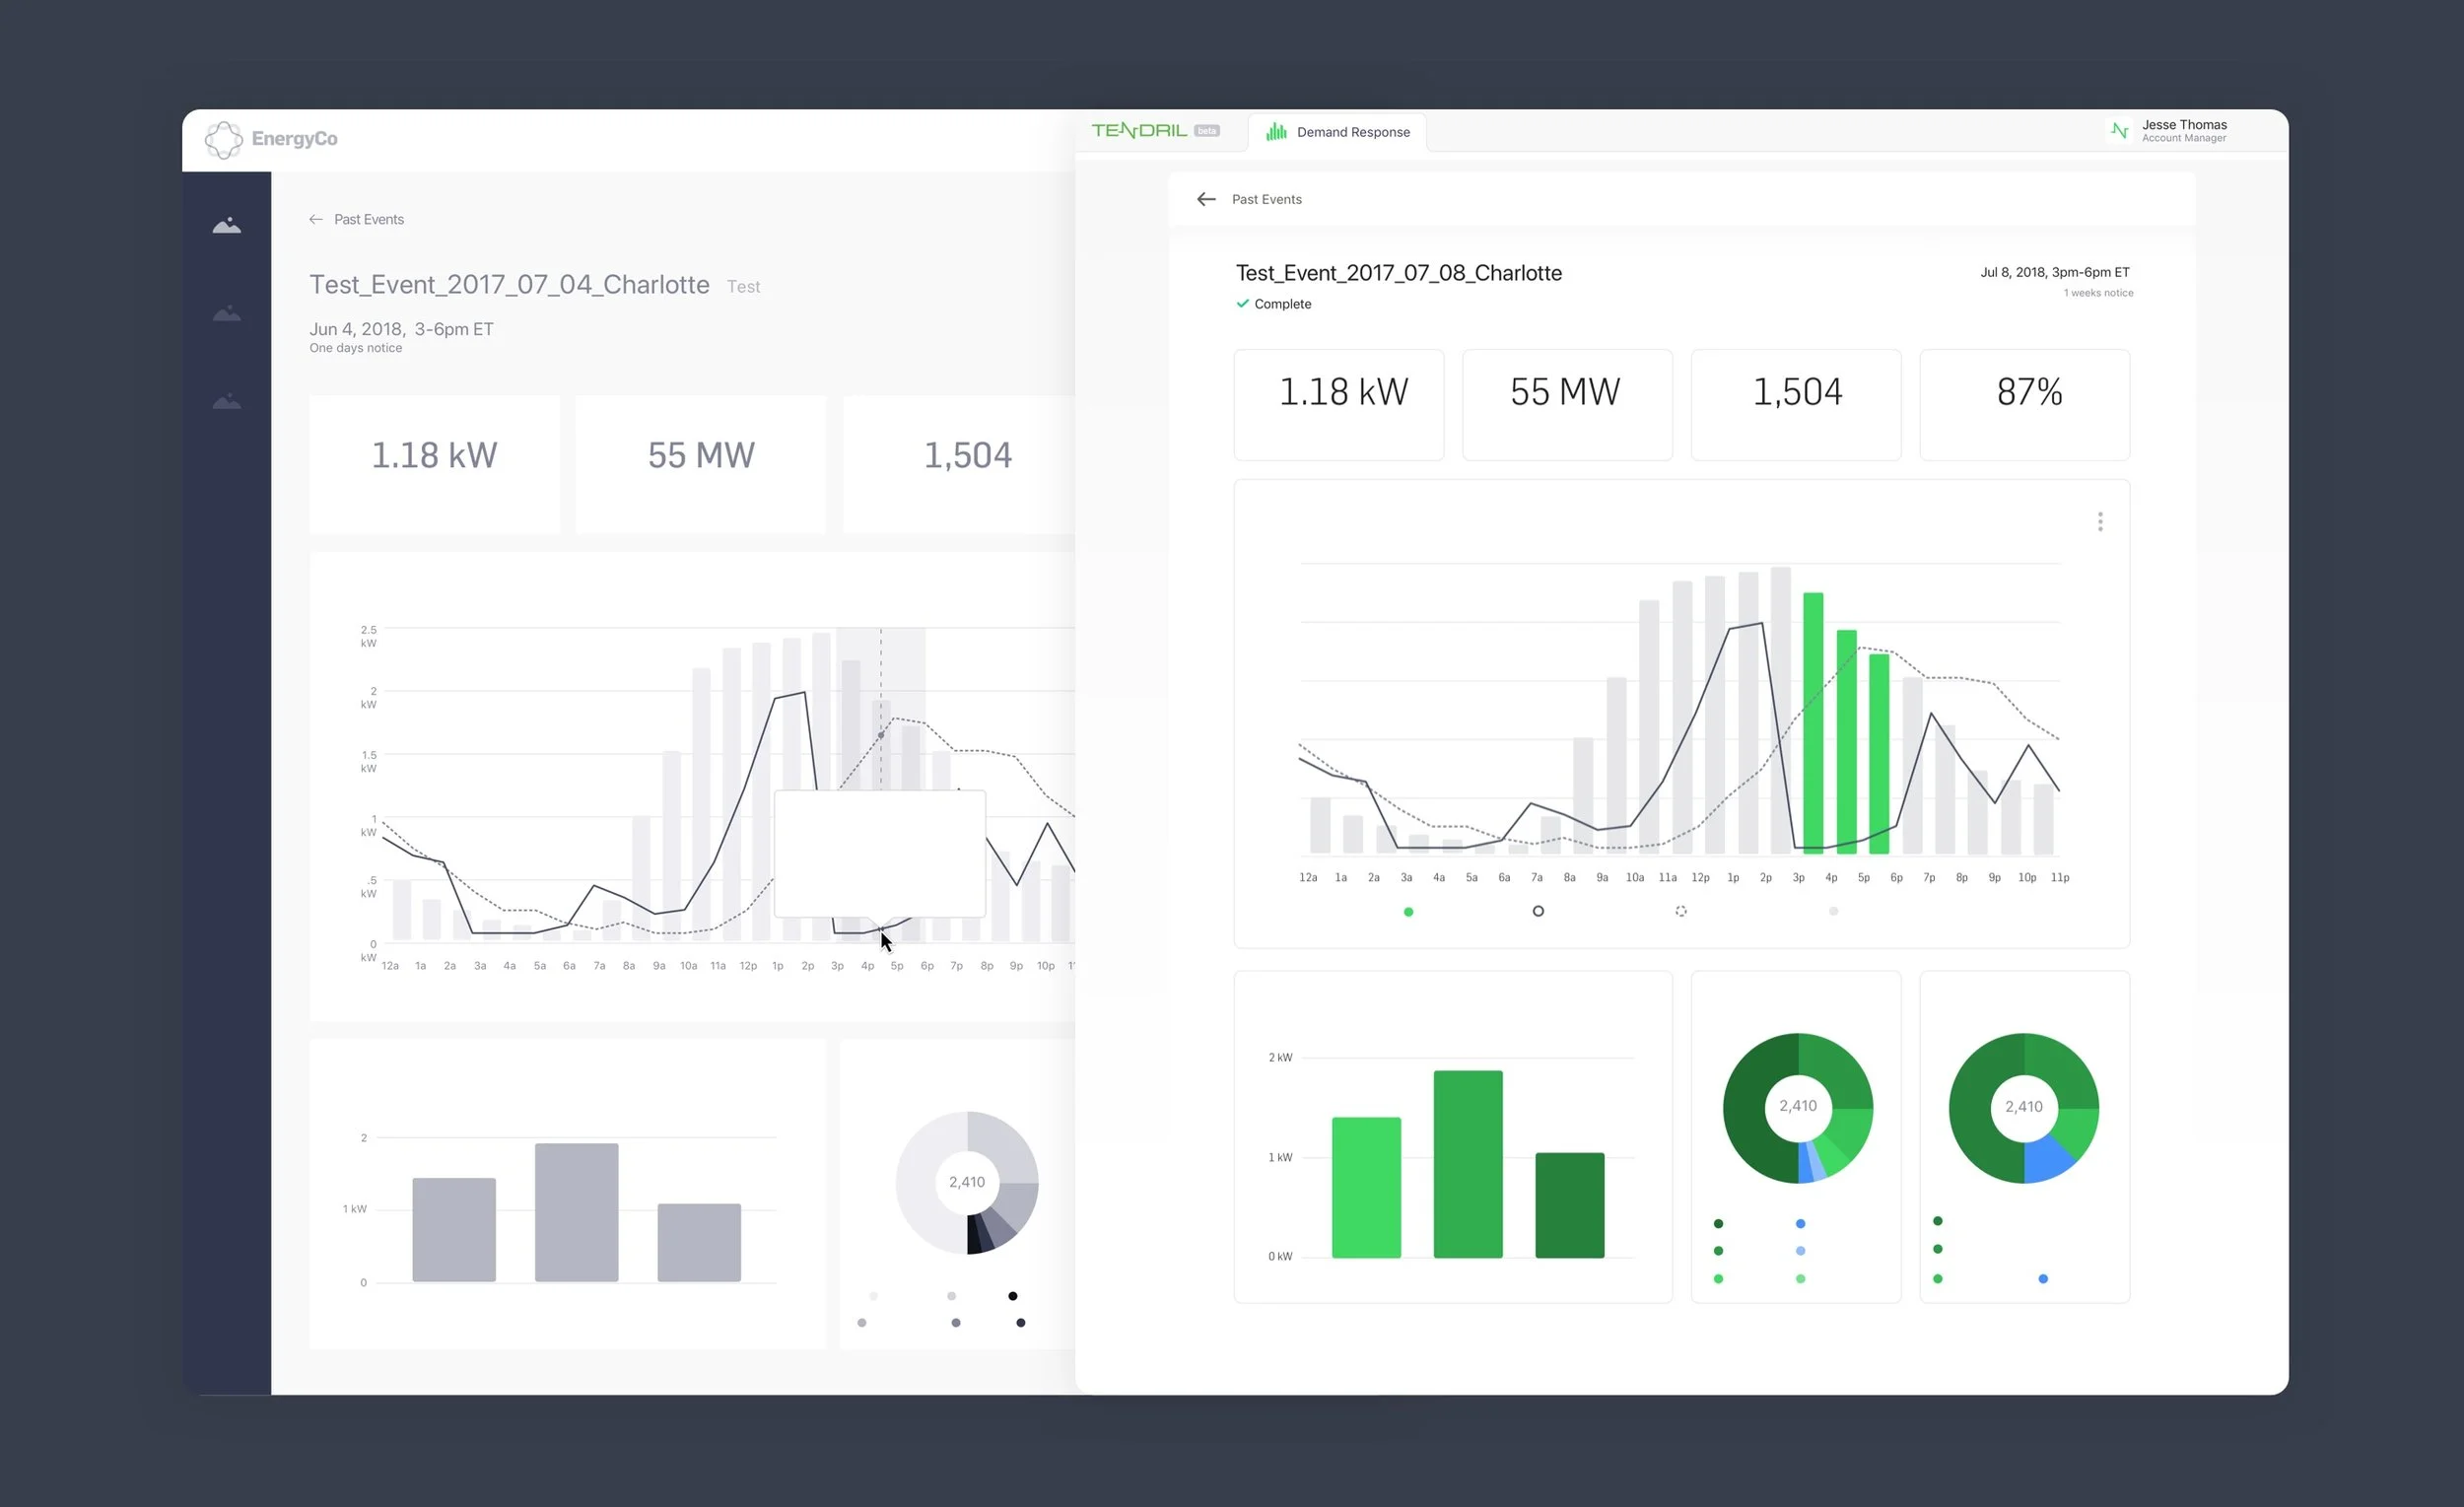
Early wireframes I created paired with the final UI. Some data has been omitted for proprietary reasons.
Outcomes
The DRMS launched in May of 2018 and is still in use today. Throughout the summer, we gained valuable learnings from talking to our users that continued to help inform future iterations and the roadmap.